Amateur Radio Astronomy
The aim of this site is to encourage others to try detecting pulsars and to show that it may not be as difficult or as expensive as they may think.
In Spring 2015, a fellow enthusiast who had access to a 30m dish, collected data on the Vela pulsar enabling a sensible evaluation of the suitability of less expensive amateur equipment.
The history of amateur pulsar detection has not been without controversy and some still think that verification by professional software is the only way.
However, preferred software such as PRESTO was not intended for amateur data verification but for the speedy discovery of new pulsars and is unsuitable for confirming true acquisitions with SNR less than about 7:1.
It was easy for early amateur pulsar hunters to mistake noise spikes for pulsars.
This has led to some overreaction by others proving the obvious that spectrum analysis of random noise has a high probability of producing noise peaks at the pulsar frequency.
The folding algorithm is highly selective and is far more effective than spectral techniques, such as FFT, in recovering a true pulsar.
Its fine filtering property also identifies residual noise spike ambiguities that become more troublesome at low pulsar SNRs.
The investigation reported on this site is based on a measured scientific study of methods to discriminate low SNR pulsar pulses from RFI and noise spikes.
The evidential process begins with a full design analysis and calibration of the chosen receiving architecture; followed by steady development of data processing algorithms that take into account the properties of real pulsar pulse trains, RFI and folded noise to improve discrimination and identification confidence.
The project white papers referenced below contain full verifiable information on the methods, processes and logic explored.
Comments, criticism and discussion is welcomed, email: pulsar@y1pwe.co.uk
Introduction
Pulsar detection conventionally relies on synchronously integrating or folding matched pulsar rotation periods of a data record.
The final pulsar amplitude is the linear sum of the amplitudes in each data period, whereas the residual noise is the average of all the period noise patterns.
Professional radio astronomers use statistical methods to confidently recognize a pulsar at apparent signal-to-noise ratios (SNR) above about 10:1 or 12:1.
If the pulsar SNR is in the range, 5:1 to 7:1, an amateur observer may be fairly confident that a pulsar is present.
Natural pulsar scintillation and folded noise offsets can vary the observed SNR during a record and from day to day;
so that not all recordings may contain a usable pulsar result.
This project investigates the SNR region of 2.5:1 to 5:1; with experience a trained operator can usually spot a weak pulsar response, but recognition confidence may be low. An alternative identity could be unfortunate interference or a period-persistent noise feature.
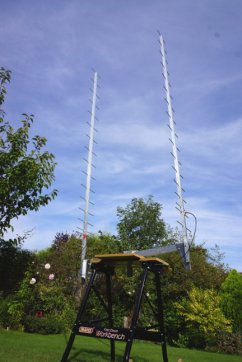
The project first stage described a back-yard, small portable radio telescope with processing software capable of collecting sufficient data over a 2-3 hour time-frame to detect the B0329+54 pulsar, albeit at low level.
The second stage, discussed the pros-and-cons of recognizing pulsar detections using analytical rather than statistical techniques; this concentrated on algorithms that exploited the pulsar pulse train properties to identify a true pulsar pulse candidate.
The third stage, looked at spectrum analysis techniques and showed that by pre-conditioning the data and using coherent folding, analysing the harmonics added new slants on the recognition process.
The fourth stage tackled the recognition process by investigating the folded result's base noise properties and shows that cross-correlating multiple partial-data fold results, enhances and confirms recognition of the true pulsar candidate by suppressing the noise.
The fifth stage sought to duplicate and add to the PRESTO algorithms using the more sensitive SNR rather than the Chi-square statistic.
Whilst all the techniques covered in this project may not be necessary to prove detection in all cases, they do add credibility supported by a firm math grounding to prove that low-level pulsar recognition is now well within the realms of amateur capability, even with limited resources.
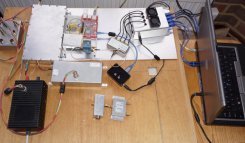
Minimal Receiver System and Early Results
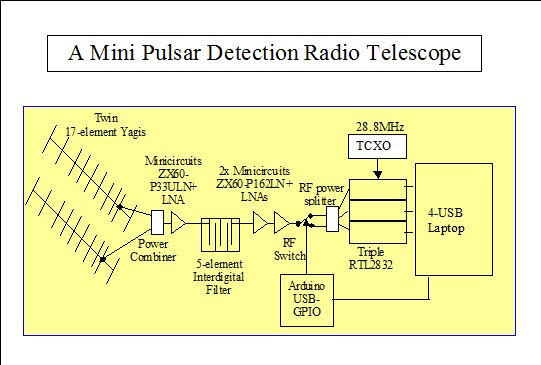
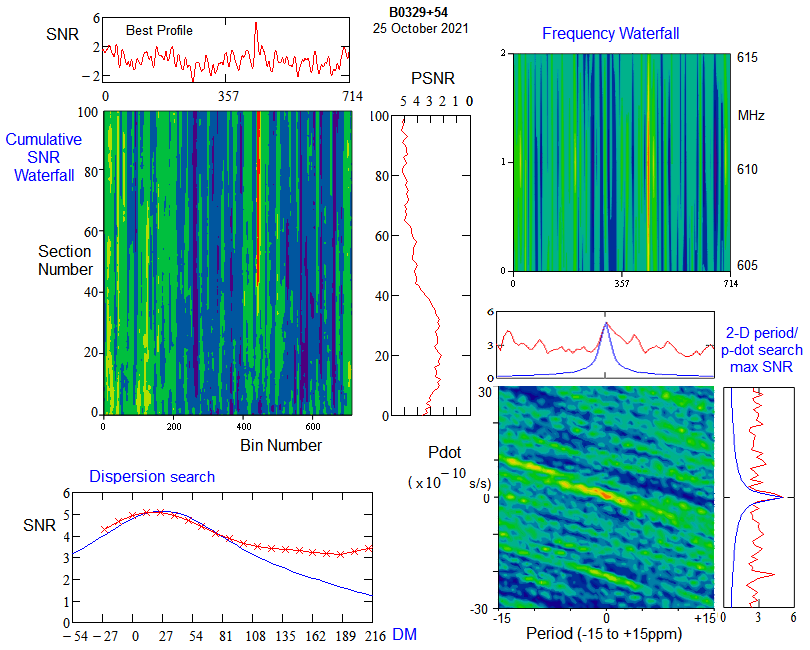
The plotted presentations of pulsar B0329+54 below analyse data collected over a 4.5 hour period
using a twin 17-element Yagi feeding a 10MHz Bandwidth Airspy SDR.
Low SNR Pulsar Discriminator
After matched-period folding, the final pulse amplitude is the linear sum of the pulsar amplitudes in each data period, whereas the residual noise is the average of all the period noise patterns.
For weak signal records, the problem is sorting out a pulsar intercept from the residual folded noise peaks.
Analytical approaches to pulsar recognition use a period and dispersion search procedures.
By adjusting search parameters, matching predictable characteristic shapes, provides greater confidence in pulsar identification.
This new approach to recognizing a true pulsar signal concentrates on eliminating the residual fold algorithm noise by exploiting the minor differences in the noise profile of half-data folds.
The data is first conditioned to enable the period data to be re-ordered in a number of ways to modify the half-file folded noise patterns whilst not affecting pulsar intercepts or timing.
Cross-correlating multiple 50% sections of the re-ordered data sets, further reduces the noise base leaving the constant pulsar pulse unmodified and visible to much lower signal-to-noise levels.
The result of this operation is plotted below.
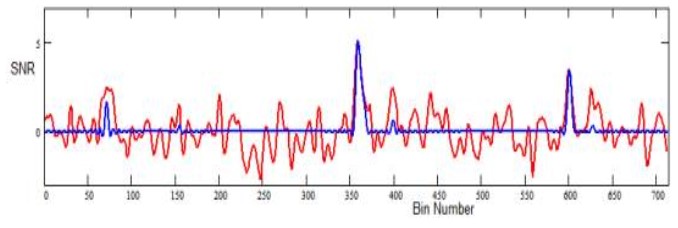
The red plot is the result of a standard single period data fold using real data acquired by a minimal pulsar receiving system.
At bin number 358 is a typical weak response of the B0329+54 pulsar showing a signal-to-noise ratio of 5.3:1.
The response at bin number 600 is a simulated pulsar added to the real data with a true signal-to-noise ratio of 3.5:1.
The blue plot is the new pulsar discriminator response.
The discriminator functions by matching the pulsar response accurately whilst removing or attenuating most of the noise peaks that might have caused ambiguity.
Postscript
To complete the circle, the new recognition algorithm has been applied to data used in the project first stage.
In this stage, an 8-point manual validation routine was proposed for identifying the presence of a weak pulsar.
The topmost plot in following figure is taken from the article showing the data fold plot for Dataset 24.
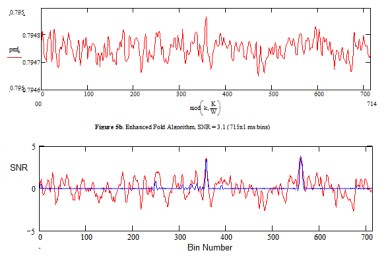
In this plot, the central spike at bin number 357 with an indicated SNR of 3.1:1 was identified as pulsar B0329+54 using the 8-point check list proposed.
The lower plot shows the new noise-reduction algorithm result on the same raw data but with a test pulse SNR = 3.8 inserted at bin 558.
With some modest RFI blanking, the indicated pulsar SNR at bin number 357 improved to 3.6:1.
The blue plot using the new correlation recognition algorithm confirms full recognition of both real and simulated targets. Q.E.D.
Pulsar Detection White Papers
Note: Due to excessive demand and pdf-liking bots my web page has been archived twice.
For bona-fide users I have had to modify the pdf document links by adding a space before the .pdf extension.
To download wanted documents successfully, you need to remove this space in your browser window.
My apologies for the inconvenience.